••
Oil Above 100 USD Inflation Pressures and Market Shifts
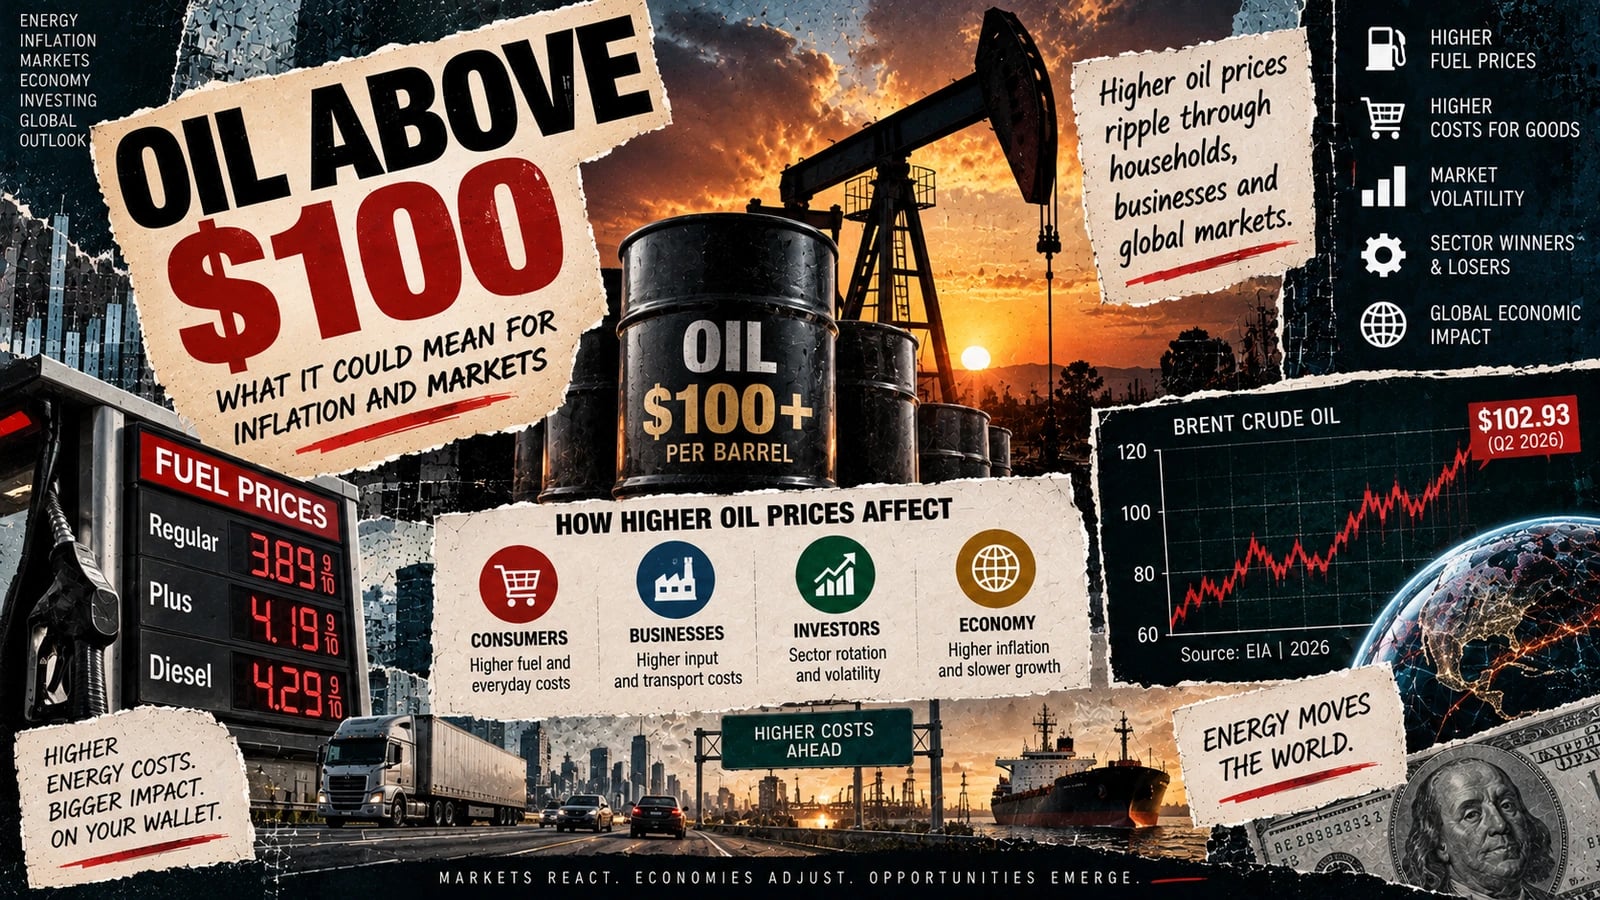
Oil above USD 100 per barrel raises inflation, pressures consumer spending, and reshapes sector performance. This guide explains the transmission channels, Fed dilemma, and practical implications.
Share Article:
Quick Take
- Oil above USD 100 per barrel can push headline inflation higher, raise transport and production costs, and pressure consumer spending. The economic impact depends less on the initial price spike and more on how long crude stays elevated, what caused the move, and whether higher energy costs begin spreading into broader inflation.
- Markets do not respond uniformly. Energy producers can benefit from higher realized oil prices, while airlines, industrial companies, chemicals, and consumer-facing businesses may face tighter margins. For households and investors, the key signals to watch are the duration of the oil shock, inflation expectations, central-bank responses, and whether the disruption is driven by temporary supply constraints or stronger global demand.
Oil above USD 100 per barrel changes the math for households, businesses, and investors. A sustained move above that threshold tends to push headline inflation higher, squeeze consumer spending, and reshape sector performance across equity markets. The severity depends on how long prices stay elevated and whether the increase reflects a supply shock or stronger demand.
For context, Brent crude averaged USD 102.93 per barrel in the second quarter of 2026 and remained volatile in the months that followed, with the U.S. Energy Information Administration projecting a 2026 annual average of about USD 91 per barrel.
That distinction matters. An oil price spike driven by geopolitical supply disruptions behaves differently from one driven by booming global demand. The former can reverse quickly once supply normalizes. The latter tends to be stickier and more inflationary over time.
How Oil Above USD 100 Reaches Consumer Prices
Oil is not just gasoline. It is a feedstock for plastics, fertilizers, synthetic fabrics, and thousands of industrial processes. When crude prices rise, those costs ripple through the economy with varying lags.
Direct Energy Costs Hit First
The most immediate impact shows up at the pump and in household utility bills. In the United Kingdom, Consumer Price Index inflation rose from 2.9% in July 2026 to 3.1% in August, driven in part by higher transport and fuel costs. Petrol prices were up 20.2% from a year earlier, while diesel prices rose 27.8%.
Those figures illustrate how quickly an energy shock can feed into headline inflation.
Core Inflation Follows With a Delay
The second-round effects are less visible but more consequential for central banks. When energy costs stay elevated, businesses may eventually pass higher freight, production, and logistics expenses through to consumers.
A September 2026 StoneX analysis found that downstream energy pressure had remained more than 30% above its prior two-year norm for six consecutive months. In all four comparable completed episodes, core inflation momentum was higher three months later.
The sample is small, so it should not be treated as a rule. It does illustrate why policymakers pay attention to the duration of an energy shock, not simply the initial jump in crude prices.
A short-lived price surge may fade on its own. A prolonged one creates a greater risk that higher costs spread into other goods, services, wages, and inflation expectations.
The Fed's Dilemma: Looking Through or Responding
Federal Reserve officials face a difficult choice when oil-driven inflation accelerates. Raising interest rates does not directly restore disrupted oil supplies. It can, however, limit the risk that a temporary price shock develops into broader and more persistent inflation.
Federal Reserve Governor Christopher Waller addressed this tension in a May 2026 speech. He said the oil shock's effect on prices could dissipate before higher interest rates had time to influence the economy. At the same time, he said he could no longer rule out rate hikes further down the road if inflation failed to ease, particularly if inflation expectations showed signs of becoming unanchored.
Central banks therefore have to weigh two risks. Tighten too aggressively and they may deepen an economic slowdown caused by a temporary supply problem. Wait too long and persistent energy inflation could spread into a wider range of prices.
Market Impacts: Energy Gains, Cyclicals Face Pressure
Oil above USD 100 creates different pressures across equity sectors. The pattern is not uniform, but some industries are more directly exposed than others.
Energy Sector Earnings Improve
Higher crude prices can improve revenue and margins for oil producers, particularly when production costs do not rise at the same pace.
In late March 2026, Zacks projected full-year earnings growth for the Energy sector at 10%, up from a 5.4% estimate at the start of the year as the oil-price outlook strengthened.
Separate analysis from RBN Energy found that 38 exploration and production companies more than doubled pre-tax profits from the fourth quarter of 2025 to USD 13.67 per barrel of oil equivalent in the first quarter of 2026.
Those gains do not mean every energy stock benefits equally. Hedging policies, production volumes, debt levels, regional exposure, and operating costs can produce very different outcomes between companies.
Consumer-Facing Sectors Face Margin Pressure
Airlines, paint manufacturers, chemical companies, and fuel retailers can face higher input costs without always being able to pass the full increase on to customers.
In India, for example, higher crude prices have created earnings pressure for oil marketing companies such as HPCL, BPCL, and IOC because crude procurement costs can rise faster than regulated or politically sensitive retail fuel prices.
The pressure is not limited to emerging markets. In the United States, higher gasoline costs can reduce the amount households have available for discretionary purchases.
Financials and Industrials Can Come Under Pressure
Cyclical sectors including financials, consumer discretionary, and industrials can struggle when an oil shock raises costs while slowing economic activity.
For industrial companies, higher fuel, freight, and feedstock expenses can compress margins. Financial firms may face slower loan demand or weaker credit conditions if higher energy costs weigh on households and businesses.
The impact varies by region and depends heavily on whether the oil increase is caused by constrained supply or strong economic demand.
Sector Impact Comparison
| Sector | Typical Response to Oil Above USD 100 | Key Driver |
|---|---|---|
| Energy | Positive earnings revisions | Higher realized crude prices |
| Consumer Discretionary | Negative | Reduced household spending power |
| Industrials | Mixed to negative | Higher transportation and input costs |
| Airlines | Negative | Higher jet fuel costs |
| Chemicals | Negative | Feedstock cost pressure |
| Financials | Mixed | Inflation pressure versus slower growth |
These are illustrative historical patterns rather than guaranteed sector outcomes.
A Simple Calculation: What USD 10 More per Barrel Means
Suppose crude oil rises by USD 10 per barrel and stays there.
The EIA has historically estimated that a USD 10-per-barrel change in crude oil prices can translate into roughly USD 0.24 per gallon at the gasoline pump, although the actual pass-through varies with refining margins, inventories, taxes, and other market conditions.
For a household driving 15,000 miles per year in a vehicle averaging 25 miles per gallon, annual gasoline use would be about 600 gallons.
At USD 0.24 more per gallon:
600 gallons × USD 0.24 = USD 144
That would mean roughly USD 144 in additional annual fuel costs, assuming driving habits and fuel efficiency remained unchanged.
The effect on any one household may look modest, but across millions of consumers and businesses, sustained increases in transportation costs can become a meaningful drag on spending and margins.
Historical Perspective: Not Every Oil Spike Causes a Recession
The oil shocks of the 1970s helped establish the idea that sharply higher energy prices inevitably lead to severe economic downturns. Later episodes showed that the relationship is more complicated.
Research from the Dallas Fed has emphasized that the economic impact of oil shocks depends on the source of the shock, monetary-policy conditions, and the broader economic environment. The 1986 collapse in oil prices, for example, did not produce the large economic expansion that a simple linear relationship between oil prices and growth might predict.
The period surrounding the 2003 Iraq War offers another useful example. In the run-up to the U.S. invasion, crude oil prices rose more than 45% between December 2002 and February 2003, reaching nearly USD 40 per barrel as markets priced in war risk alongside supply disruptions in Venezuela and concerns about Nigeria.
After the invasion began, oil prices fell from their pre-war highs rather than continuing to surge.
The episode illustrates why geopolitical tension alone does not determine the economic outcome. Expectations, actual supply losses, inventories, demand conditions, and monetary policy all influence how an oil shock affects the wider economy.
Practical Takeaways for Investors and Households
- Focus on duration, not only the initial spike. A brief move above USD 100 can have a smaller economic impact than prices remaining elevated for several months.
- Watch how energy companies respond. Oil producers may benefit from higher realized crude prices, although individual company performance depends on costs, production, hedging, and balance-sheet conditions.
- Watch inflation expectations, not just headline CPI. If longer-term expectations remain anchored, central banks have more flexibility to look through a temporary supply shock. Persistent increases create a more difficult policy problem.
- Monitor consumer-discretionary sectors. Businesses that depend heavily on discretionary spending can face pressure when fuel costs absorb a larger share of household budgets.
- Follow the supply story. Geopolitical disruptions can reverse if shipping routes reopen or production returns. Demand-driven price increases may behave differently and can persist for longer.
Disclaimer: This article is for informational and educational purposes only and is not personalized financial, investment, tax, or legal advice. Consult a licensed professional for advice specific to your situation.
Frequently Asked Questions
Does oil above USD 100 always cause a recession?
No. Historical evidence shows that some oil price spikes have been followed by recessions while others have not. The outcome depends on how long prices remain elevated, what caused the increase, the strength of the economy, and how monetary policy responds.
How long does it take for oil prices to affect inflation?
Direct effects on gasoline and diesel prices can appear relatively quickly. Broader pass-through into goods and services may take several months as businesses absorb or pass on higher transportation, production, and logistics costs.
Which sectors tend to benefit most from higher oil prices?
Oil producers and other upstream energy companies can receive the most direct earnings benefit from higher crude prices. The effect varies considerably between companies depending on production levels, costs, hedging, and other factors.
Should the Fed raise rates when oil prices spike?
There is no automatic policy response. Raising interest rates does not increase oil supply, so policymakers may look through a temporary supply shock. If higher energy costs begin feeding into broader inflation and inflation expectations, the case for tighter policy can become stronger.
From the Desk
All Markets →More in Markets
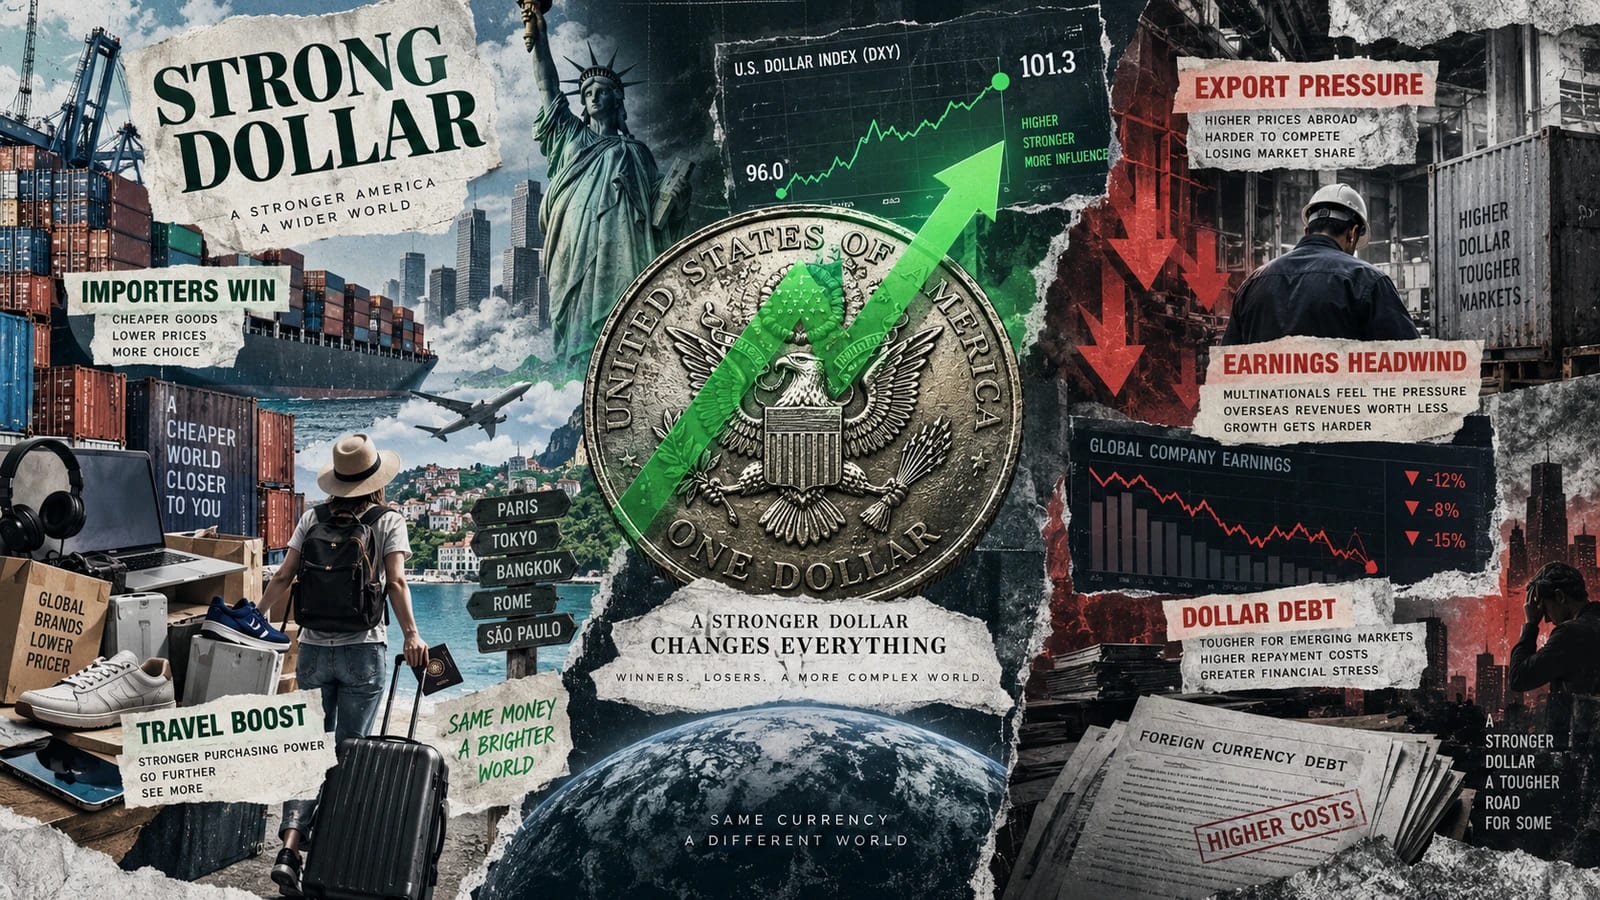
Strong Dollar Explained: Who Wins and Who Loses When the US Dollar Rises?
A stronger U.S. dollar can lower import costs and make overseas travel cheaper, while creating pressure for exporters, multinational companies and borrowers with dollar debt. This guide explains why the dollar rises and who benefits or loses.
Fresh Reporting
Browse All Stories →Latest from The Ledger

0% Balance Transfer vs Personal Loan: Which Is Better for Credit Card Debt?
A 0% balance transfer may save more if you can repay the debt during the promotional period. A personal loan offers fixed payments and more time. Compare the real costs before choosing.


Leave a Comment
Your email address will not be published. Required fields are marked *